Introduction to the Wave Program
(To be used with the Specs wave program)
Purpose
The purpose of this activity is to give you the
chance to "see" and explore the interaction of waves. In your everyday
life you have probably experienced this type of interaction many times.
This activity will allow you to control the interaction and help you to
visualize what happens. How does the interaction affect the way you view
your surroundings?
Words you should know
amplitude, constructive interference, destructive
interference, diffraction, frequency, fundamental frequency, index of refraction,
phase angle, and superposition.
glossary
of terms
Some
background information
Wave
applications to everyday life.
How to use the wave program

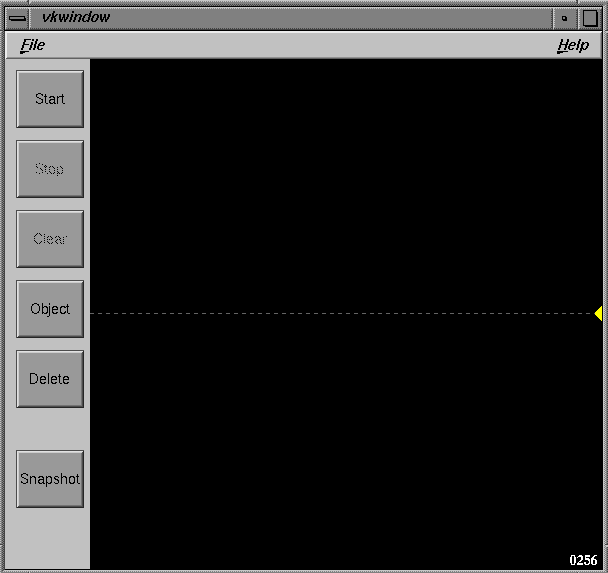
The vkwindow has six buttons: Start, Stop, Clear, Object, Delete, and Snapshot.
Start
This is the top icon, in the vkwindow, it is the run button.
Stop
The "stop sign" stops the wave. This does not clear the display. If you click run again the wave will continue where it left off.
Clear
This will clear the display of the waves. It does not clear the
objects that you have placed on the screen. To clear those you need to
select each and press backspace/delete.
Object
The forth
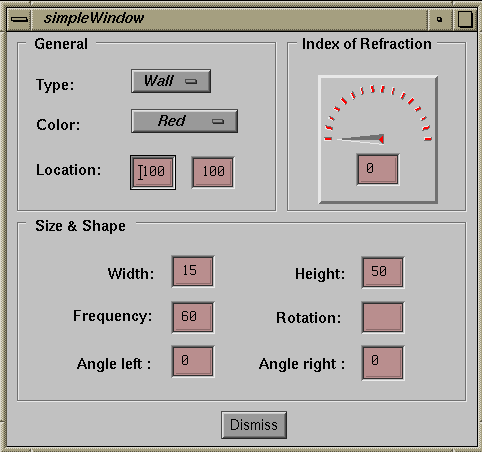
icon is the object tool. When you click on this icon you create an object
with the characteristics you have selected in the simple Window. You can
change these characteristics using the boxes provided. Note the object
you are changing must be selected. You will know which object is selected
by the white dot in the center of the object, or if the object has been
rotated it will be in the top left corner of of the object. Note only the
walls can be rotated.
Object placement in the vkwindow can be controlled
by the location in the simple Window or by clicking and dragging the object
to its new location. You can also use the arrow keys to move the object.
If you hold down the shift key and use the arrows the object moves much
faster.
Delete
If you wish to delete the object, select the object and then press the delete button.
Snapshot
This button will allow you to take a picture of the vkwindow window. A dialog box will appear which allows you to save the image in a convenient location. The images may be viewed using Ipaste or other viewing software.
The dotted line with the yellow triangle, called
the probe, sets the location where the wave will be graphed. This can be
moved during a run. The counter at the bottom of the window tells you the
location of the probe line. This will be useful in finding the separation
distance between different in objects.
 The simple Window is where you can change the size,
shape, and color of the object. The rotation angle moves the object clockwise
from the bottom. If you wish to rotate counterclockwise use negative numbers.
The angle left and angle right have no effect on the wall or the oval.
They only work on lens. You can change the frequency of the wave at anytime.
The light bans are the crest of the wave, and the
dark bans are the troughs.
Note: If you place and object off the screen you
can not get it back. Example, if you rotate an object and the top corner
is no longer in the window you can not select it to move it to a new location,
using the cursor. If you have not clicked on anything else you may be able
to use the arrow keys to bring it back. Be Careful!
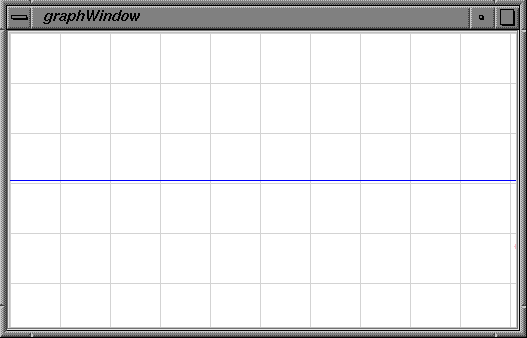
 On the graphWindow the copy button will make a copy
of the current graph and change the color of the next graph. You may make
multiple copies at one time, each one will be a different color. The clear
button will clear all copies of graphs stored when you make the next run.
The pink dot on the graph line represents the location
of the cursor. At any time you can press the "D" key on the keyboard and
freeze its movement in the "x" direction. It will still float on the wave
in the "y" direction. Press the "D" key again to unfreeze the dot.
Wave Propagation Lab
Step 1: Set the frequency to 40. Run the program.
Step 2: Place the cursor in the vkwindow.
Note the movement of the pink dot in the graphWindow. As the wave passes
by the pink dot "floats" up and down but does not travel with the wave.
Does this mean that the wave is transmitting
energy, matter, or both?
Step 3: You can see the crest and
troughs of the wave front moving from left to right across the vkwindow.
How does this relate to the image in the graphWindow?
Can you see that the waves move in a direction
that is perpendicular to the wave fronts. This is called rectilinear propagation
or straight-line motion.
Step 4: Make a copy of the graph by pressing
the copy button in the graphWindow.
Step 5: Now change the frequency
to 20. Continue running the program and note the change in the wavelength.
How did the wavelength change in relation to
the frequency?
Step 6: Try to change the frequency so
that the wavelength is three times as great as it was with a frequency
of 40.
What was the frequency? How did you figure
it out?
Return


