NUMERICAL SIMULATION OF COMPRESSIBLE TURBULENCE
ASCI Strategic Investigation Team:
David H. Porter, Paul R. Woodward, S. E. Anderson
Laboratory for Computational Science & Engineering, University of Minnesota
& Karl-Heinz Winkler & Stephen W. Hodson
Los Alamos National Laboratory
October 18, 1997
During the spring and summer of 1997, research teams from the University of Minnesota's Laboratory for Computational Science & Engineering (LCSE) and from the Los Alamos National Laboratory (LANL) joined forces to exploit the new Silicon Graphics Origin-2000 computing hardware at Los Alamos. The LCSE team consisted of David Porter, Paul Woodward, and Sarah Anderson, and Karl-Heinz Winkler and Stephen Hodson made up the LANL team. Woodward's PPM gas dynamics code was adapted to this turbulence study by Porter and to the SMP cluster computer architecture by Anderson, Woodward, and Hodson. A parallel efficiency of over 90% was obtained on 128 Origin-2000 processors, with a total sustained performance of 14 Gflop/s using a special version of the PPM turbulence code. In this special code interprocessor communication is performed simultaneously with computation in order to increase performance. This work was supported by the DoE's Accelerated Strategic Computing Initiative (ASCI). This calculation on a grid of over a billion cells is one of the largest fluid dynamical simulations completed to date on the initial ASCI hardware. This simulation represents a continuation of the first billion-cell turbulence simulation, begun by the LCSE team in 1993 on a prototype cluster of shared memory multiprocessors built for the project by Silicon Graphics. The LCSE team was able to sustain 4.9 Gflop/s performance on that prototype system, but did not have sufficiently long access to the system to complete even a single billion-cell run. It required the installation by Silicon Graphics of the ASCI program's initial delivery system at Los Alamos to provide both the capability and capacity to carry out this exceptionally large fluid turbulence simulation.
Fluid turbulence is the term used to refer to extremely complex flow which is driven by a number of fluid instabilities, such as the Kelvin-Helmholtz instability of shear flow and the Rayleigh-Taylor and Richtmyer-Meshkov instabilities of accelerated multi-fluid interfaces. Turbulence, especially in the regime of compressible flow, plays an important role in many fluid dynamical problems important to the ASCI program. This team therefore set out to simulate homogeneous, compressible turbulence on the ASCI hardware. This numerical experiment allowed the team to obtain data describing such a flow which would be impossible to obtain from any laboratory experiment. A 10 GB record of the complete fluid state at each of 40 separate times during the simulation was saved. From this 400 GB record, a wide variety of ideas relating to the statistical properties of compressible turbulence can be tested. Ultimately, accurate simplified models of this phenomenon can be constructed and verified for use in ASCI simulation codes. At present, the statistical processing of the data is still underway, but visualizations of the data provide a fascinating perspective on the complex phenomenon of compressible turbulence.
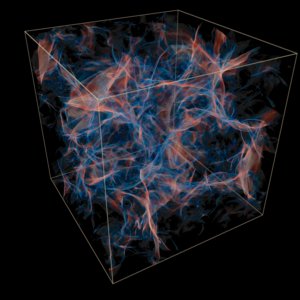
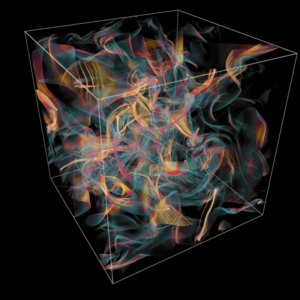
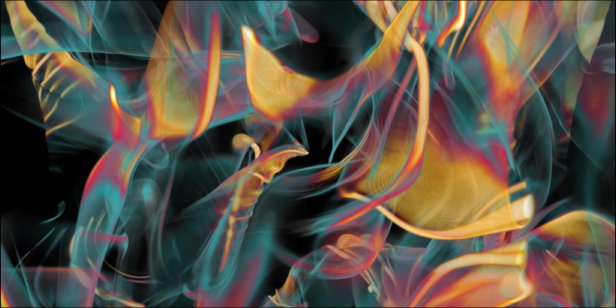
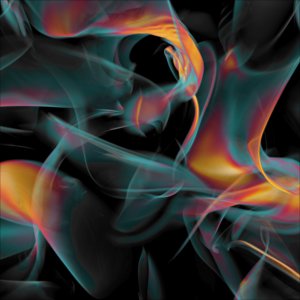
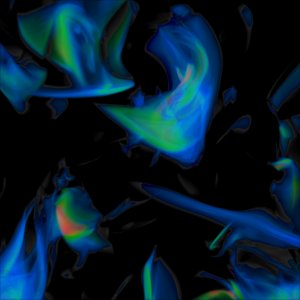
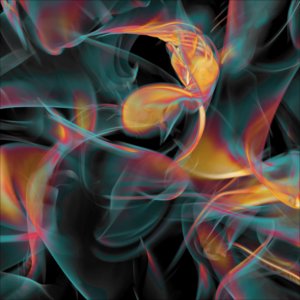
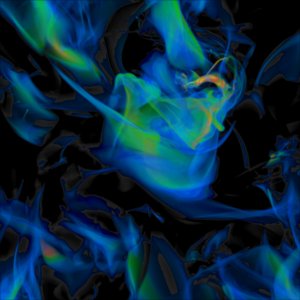
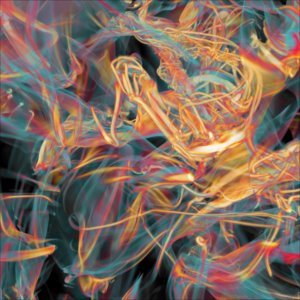
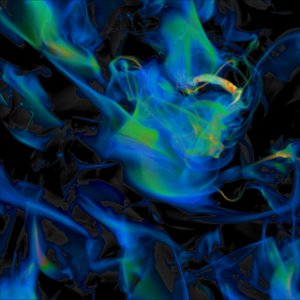
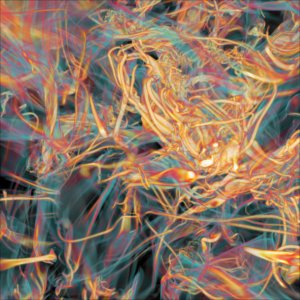
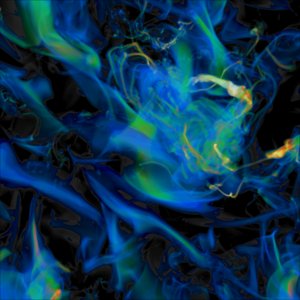
The visualizations shown here use the technique of perspective volume rendering. Each of the billion cells in the simulation grid is assigned a color and opacity related to the value of a scalar combination of fluid state variables. The illustrations below show the entropy, the vorticity, and the divergence of the velocity. When the magnitudes of these quantities are small, the opacity is also small, so that the fluid in the grid cell is effectively transparent. Increasing magnitudes of the quantities generate increasing opacities and a series of different colors ranging from blue at low magnitudes to green at the highest magnitudes. Views of the entire simulation volume are shown, but close-up views of just a section of the volume provide more detail and less confusion from the superposition of many complex fluid structures.
The entire simulation volume is shown first. Periodic boundary conditions were used in the simula- tion, so one should imagine this cube repeated indefinitely in all three grid directions. The flow is shown first at simulation time 1.7. This time is the fraction of the distance across the initial energy containing scale which has been traversed by sound waves moving at the average sound speed in the initial state. Therefore by this time an average sound wave has traversed about 85% of the distance across the problem domain. This is a compressible flow in which an initially uniform state has been perturbed by randomly oriented, isentropic, sinusoidal sound waves. These initial disturbances have wavelengths chosen from a distribution centered on half the width of the simulation cube. Their amplitudes are chosen to produce rms velocity magnitudes corresponding to a Mach number of ½. By time 1.7, shocks have formed, and the shock surfaces are displayed in the image of the divergence of velocity below on the left.
| Divergence of Velocity | Vorticity |
|---|---|
 |
 |
|
|
|
The divergence of the velocity (left) at time 1.7 is rendered to show the shock surfaces from whose constantly moving lines of intersection sheets of vorticity are laid down. The vorticity distribution is shown in the volume rendering at the right at this same time.
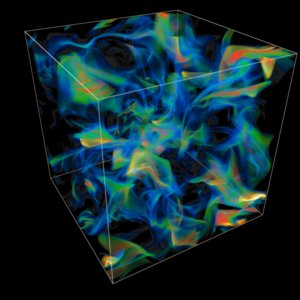
The many shock surfaces in this developing flow intersect along lines from which slip surfaces, or sheets of vorticity emanate. This is not the only mechanism for forming sheets of vorticity, but it appears to be the most important one in the early stages of this compressible flow. The vorticity image above reveals the complex web of vorticity sheets which has developed by this point. In the image to the left, the volume rendered entropy shows the effects over time of both shock-generated entropy and entropy generation by viscous dissipation in thin shear layers. Remember that in the initial state the entropy was everywhere constant. This entropy image, like the other two images above, shows the flow at time 1.7.
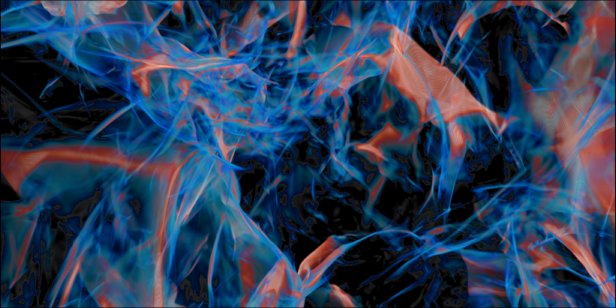 |
| The distribution of the divergence of the velocity near the center of the problem domain at time 1.7 |
 |
| Vorticity in the same region at time 1.7 |
 | The entropy distribution in the same region at time 1.7 |
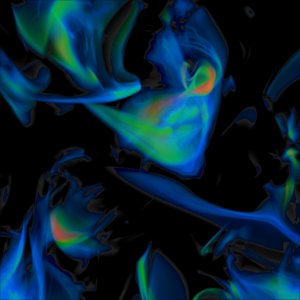
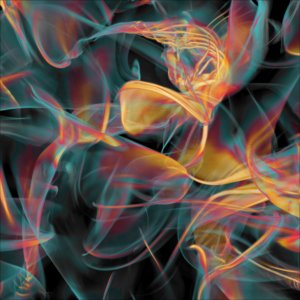
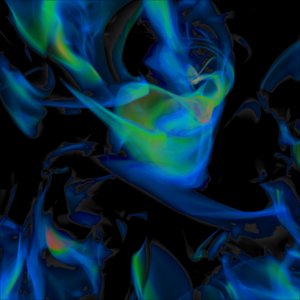
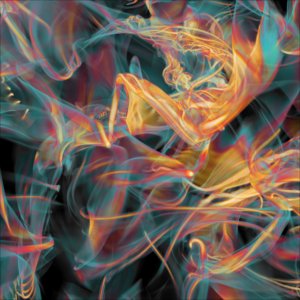
These close-up views illustrate the variety of different information about the flow that needs to be considered before a comprehensive understanding of its dynamics is possible. For these compressible flows it is not possible to untangle the flow dynamics from pictures and analysis of the vorticity alone. Instead each variable illuminates different aspects of the flow. In order to make sense of this information, it is most useful to construct long sequences of images and to animate them as movies on very high resolution displays like the 3200x2400-pixel PowerWall at the LCSE in Minnesota. This has so far proven to be the most effective means to take in the data archived from large-scale supercomputer simulations like this one. The visualizations help to create the insight that can guide the generation of more quantitative and less subjective distillations of the terabytes of data produced by simulations like this one. Although the printed format does not really allow one to appreciate the value of image animations, one can get some sense of this value from the brief sequence of images shown below. Both vorticity and entropy are displayed here at intervals of 0.1, beginning at time 1.5 and ending at time 2. When images like these are animated, especially with a slowly changing viewpoint, the three-dimensional aspects of the flow are clearly communicated. In the images below, which focus on only a portion of this complex, evolving flow field, one may observe a transition from flow conditions in which entropy generation from viscous dissipation occurs mainly in shocks to conditions in which the viscous dissipation occurs mainly in the cores of strong vortex tubes.
|
 |
0.75 |
|
 |
0.80 |
|
 |
0.85 |
|
 |
0.90 |
|
 |
0.95 |
|
 |
1.0 |